Reference
observe
The observability UI is a local web page that shows what the agent is doing while it does it: every MCP tool call on a live timeline, a mirrored view of the simulator/emulator screen, and the app’s current route, store state, and component tree. It also gives you a browser surface for your actions library — list, parameterise, and replay saved actions without touching the terminal.
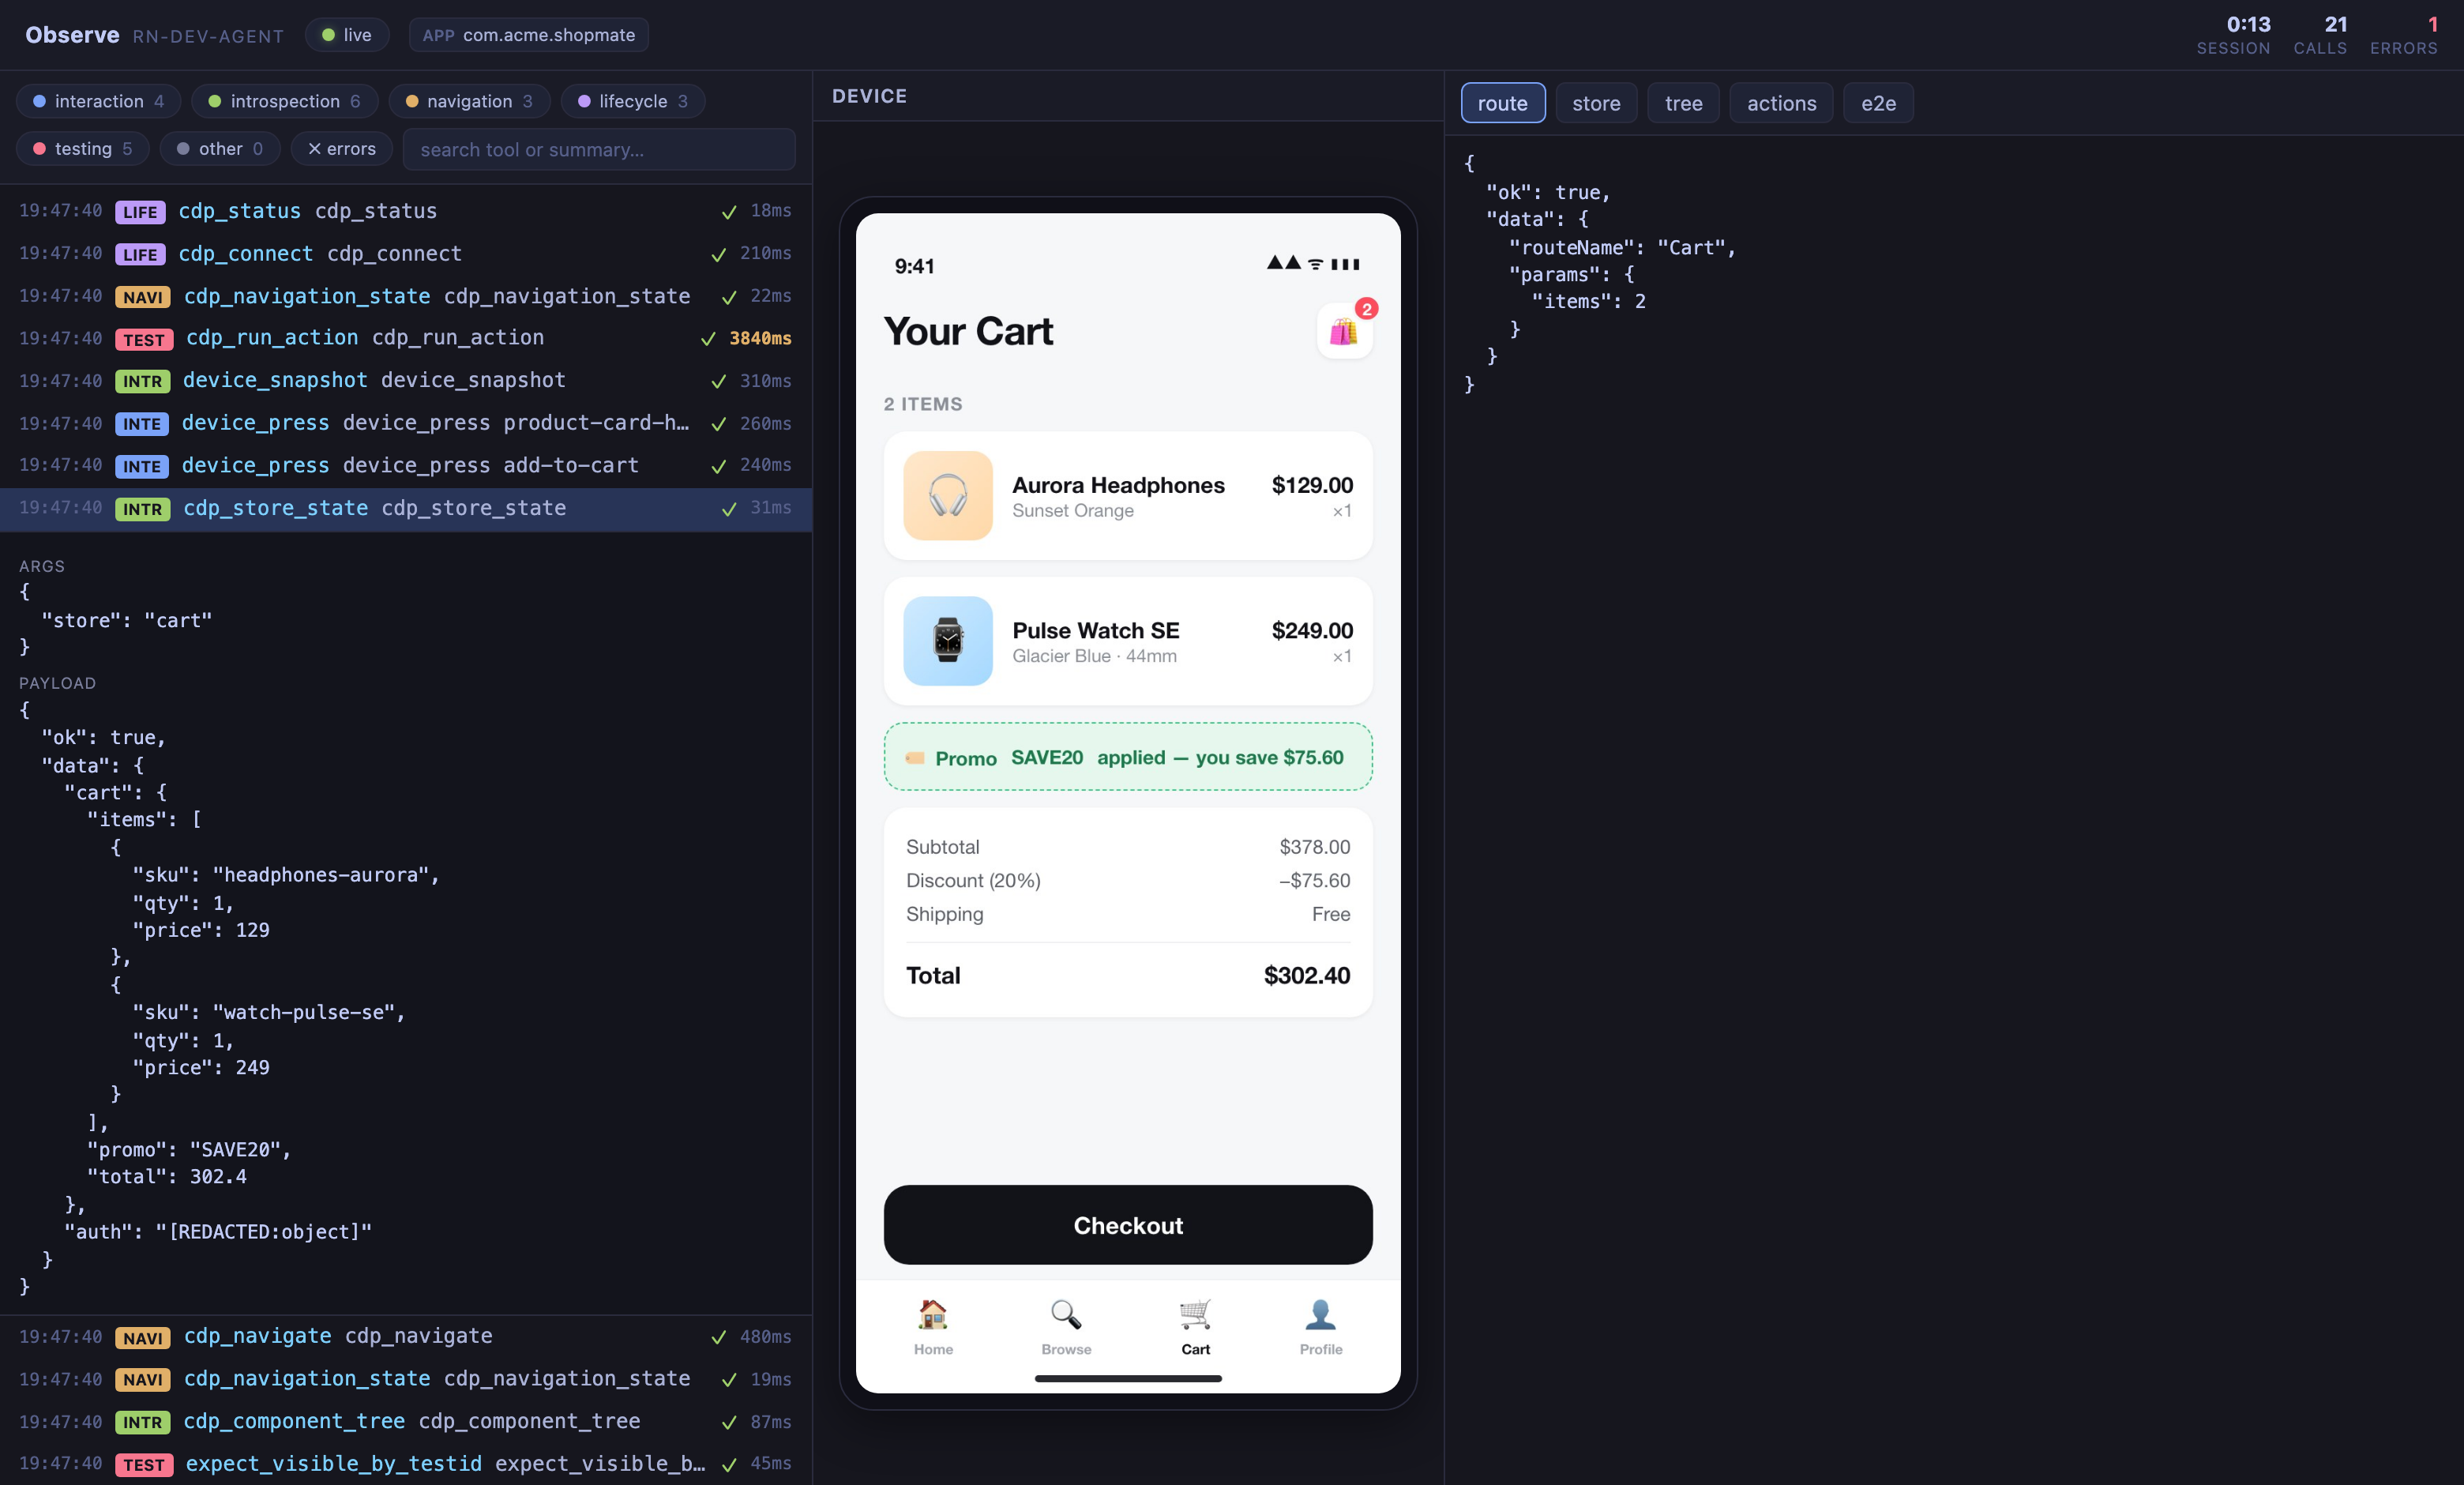
Here it is in motion — inspecting a failed flow, checking store state, replaying an action, and running the locked E2E suite, all from the browser:
Claude: /rn-dev-agent:observe [stop|restart]Codex: $rn-dev-agent:observe [stop|restart]The UI autostarts with the session in a React Native project — you normally don’t need to start anything. Invoke the host’s Observe workflow with no argument to print the URL (default port 7333); open it in a browser.
stop— shut the UI down for the rest of the session.restart— restart the server and print the (possibly new) URL. The event timeline is preserved across restarts.
An autostarted UI holds the session’s device axis, so the first rn_session(action="bind_device") stops it to yield that axis and reports observeYielded with the stopped port — bring it back with restart. A UI you bring back yourself, or started yourself, is treated as yours: it forfeits the automatic yield, and the next bind_device refuses until you stop it. See parallel session authority.
Permanent opt-out and port selection live in .rn-agent/config.json:
{ "observe": { "autoStart": false, "port": 7333 } }Environment variables RN_AGENT_OBSERVE_AUTOSTART and RN_AGENT_OBSERVE_PORT override the config.
What you see
Section titled “What you see”The page is a three-pane layout:
| Pane | Contents |
|---|---|
| Timeline (left) | Every tool call as it happens — colour-coded by family (interaction, introspection, navigation, lifecycle, testing), with duration, success/failure, and self-healing “ghost” markers. Filter by family, free-text search, or errors-only. Click an event to inspect its arguments and (redacted) payload; events that produced a screenshot show it inline. |
| Device mirror (middle) | A live mirror of the simulator/emulator screen. iOS uses idb video-stream when idb + idb-companion are installed and the client actually runs, falling back to a simctl screenshot loop otherwise — an installed-but-crashing client is reported as an interpreter incompatibility, not as a missing install. An idb stream that starts but never delivers a usable frame is also demoted to the simctl loop on the same device instead of leaving a blank mirror; the bounded wait defaults to 30s and is configurable via .rn-agent/config.json → observe.mirror.firstFrameTimeoutMs. Android streams adb screenrecord through ffmpeg. The current route is overlaid as it changes. Mirror readiness is shown as its own header pill (device live / connecting / blocked / off, plus waiting before the first mirror status or while the event stream is down, and disabled when the mirror is switched off), separate from the events live transport pill. When an authority session is present without a proven device binding, the pane renders an explicit Device blocked panel naming the typed refusal and its recovery path instead of guessing an ambient device; a pipeline that never produces a frame is closed with a visible mirror off reason after a bounded watchdog — the configured firstFrameTimeoutMs plus 15s of slack, so the source-level demotion above still gets its chance first — instead of spinning forever. The mirror is gated on the device axis alone, so a device-bound mirror keeps showing real frames even while app-state reads are refused on install authority — the two axes report independently. |
| State (right) | Five tabs: Route (latest navigation state), Store (latest Zustand/Redux snapshot), Tree (latest component tree), Actions, and E2E. The first three update whenever the agent reads that state — you’re seeing exactly what the agent saw. A refused live read shows the typed refusal code’s recovery path underneath the failure, taken from the gate’s own next action. |
Using observe with actions
Section titled “Using observe with actions”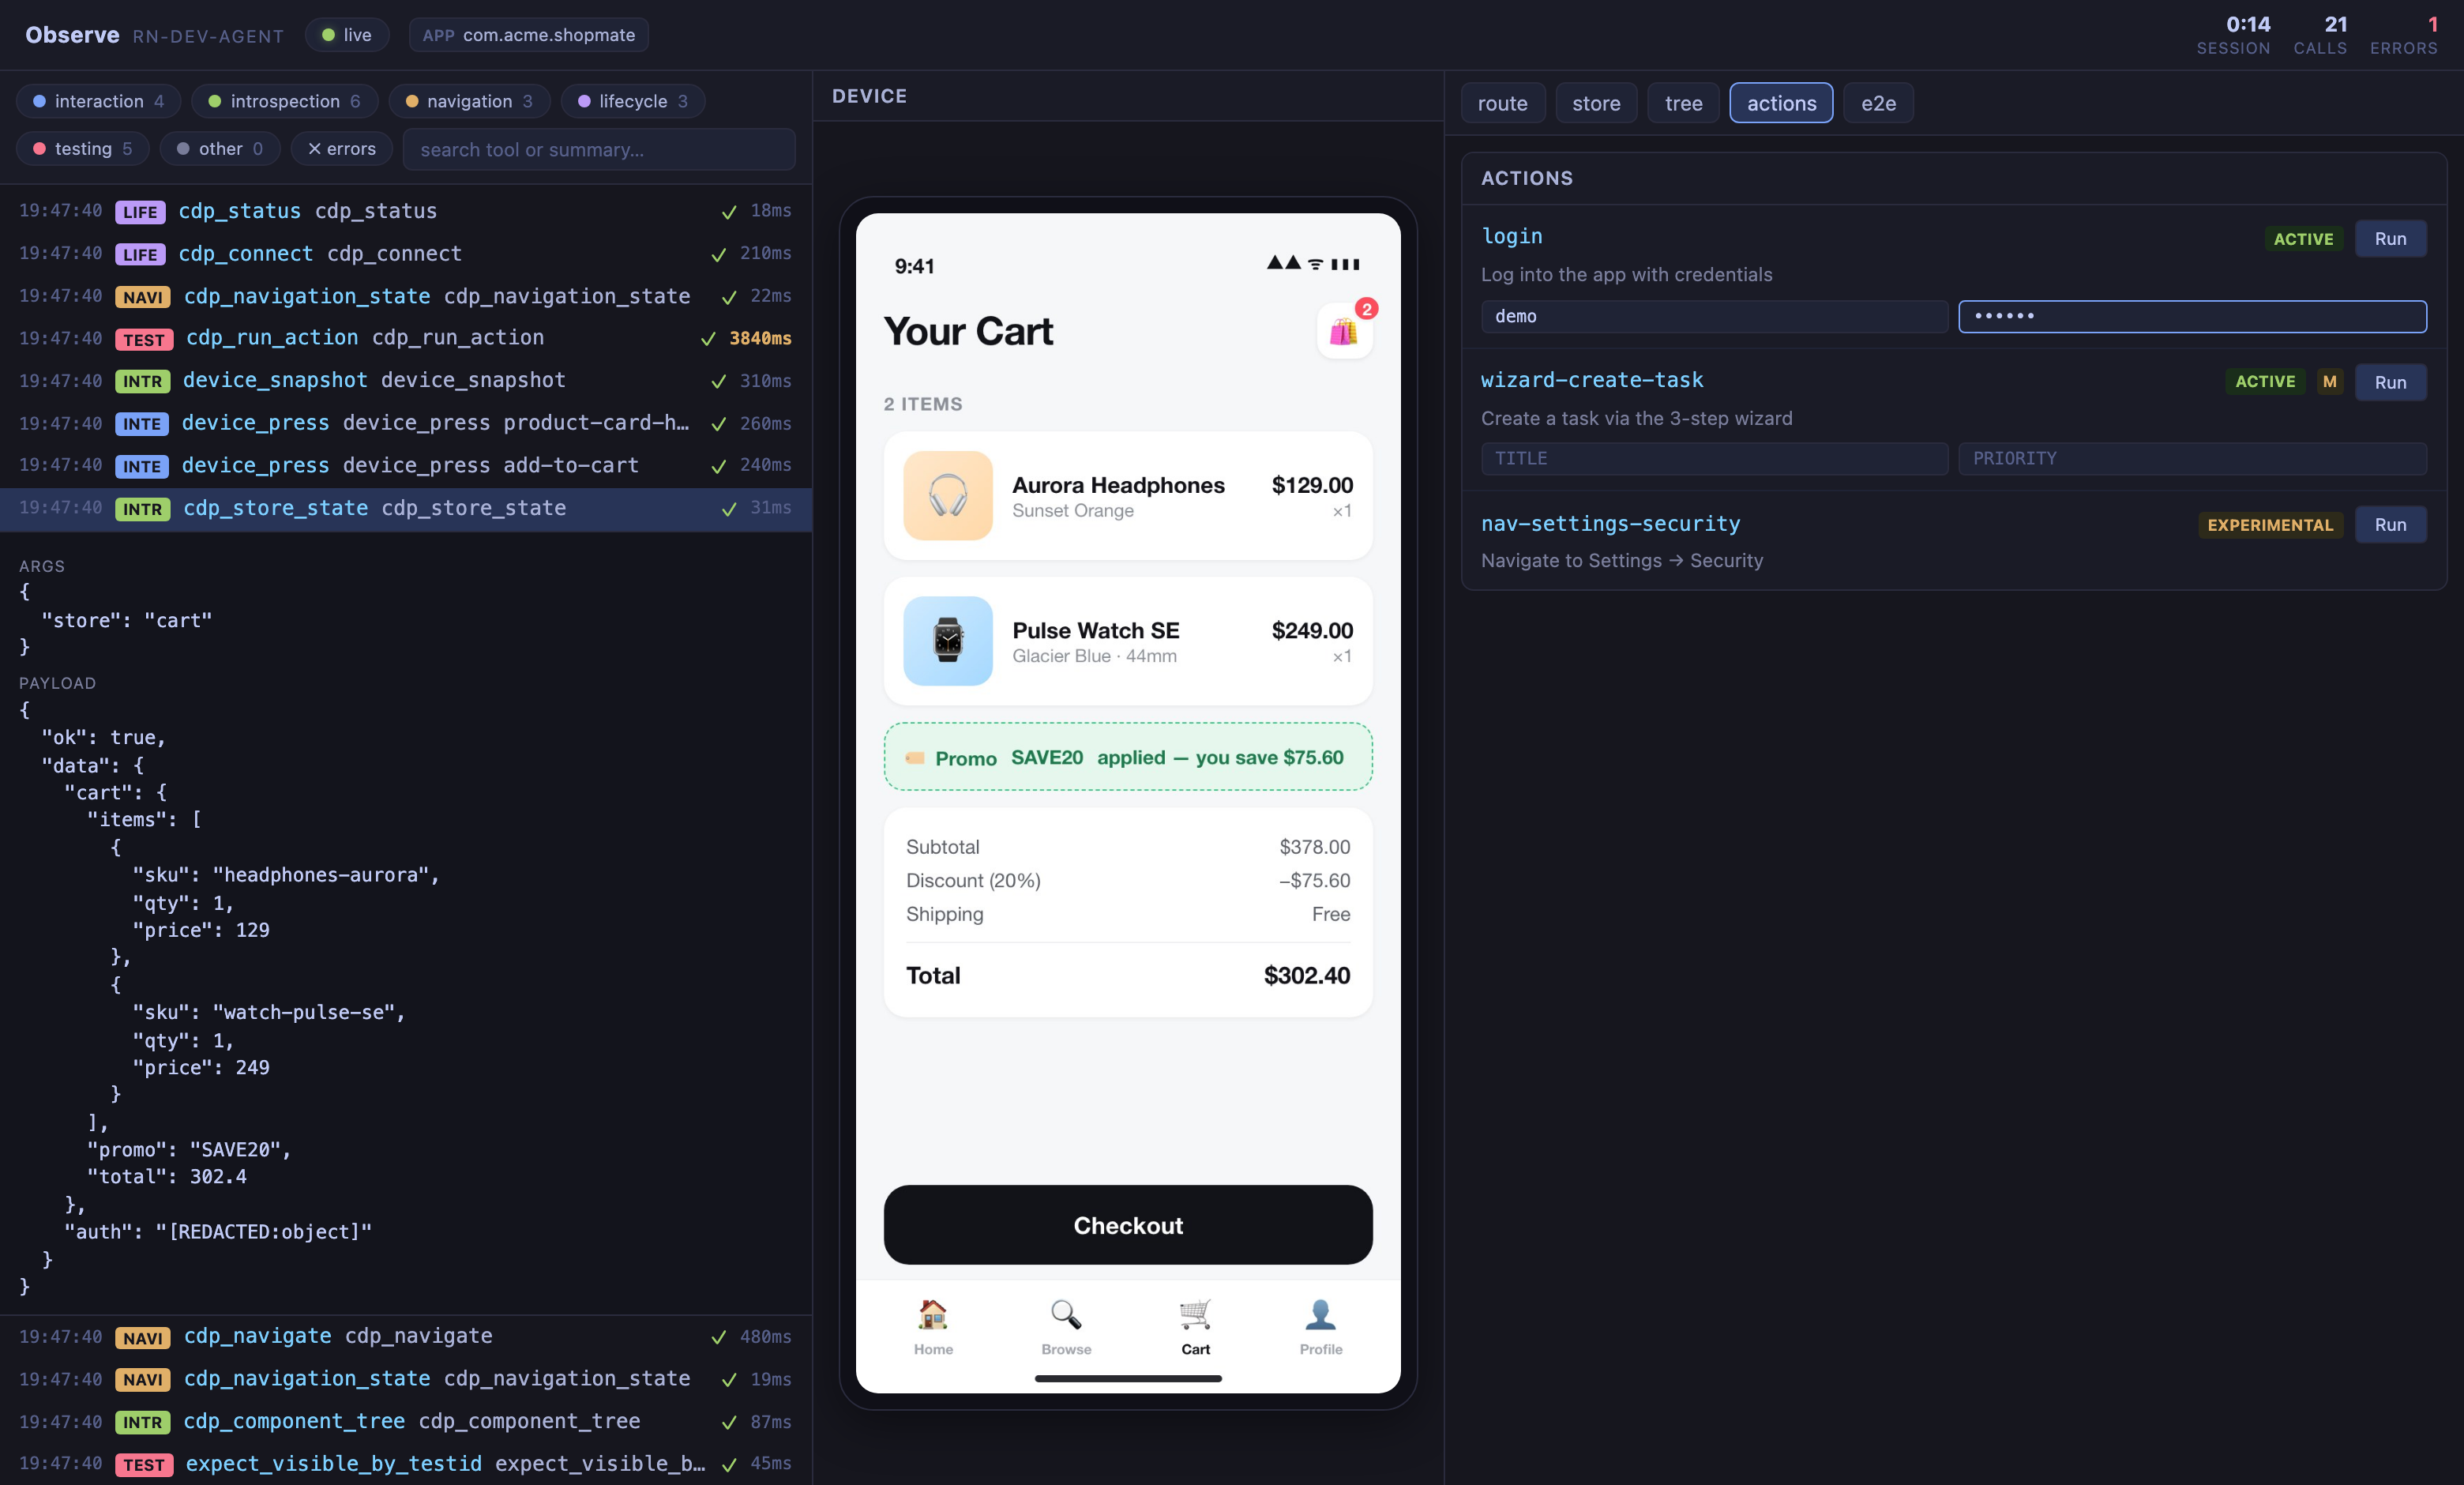
The Actions tab is a browser front-end to the same learned-actions library that /rn-dev-agent:run-action uses:
- Every action saved in
.rn-agent/actions/is listed with its id, intent, lifecycle status badge (experimental/active/deprecated), and an M marker when the action mutates app state. - Actions with
${KEY}placeholders render one input per parameter — fill them in and hit Run. Missing required parameters are flagged before anything executes. - Run replays the action through the same engine as
/run-action(cdp_run_actionunder the hood), so self-repair and run records behave identically. The replay output is shown inline on failure.
This closes a nice loop with the rest of the UI: trigger a replay and you watch the taps land in real time on the device mirror (agent-triggered replays via cdp_run_action additionally show up on the timeline as testing-family events). It’s the fastest way to answer “does user-login still pass after my change?” — no agent turn, no terminal round-trip.
If the tab says “No learned actions”, nothing has been recorded yet — run /test-feature and a verified walk will be saved automatically (see Creating an action).
The actions and E2E surfaces read the project the bound session declared, falling back to RN_PROJECT_ROOT and then to discovery from the working directory. When none of those proves a single React Native project — a foreign, missing, or ambiguous root — the tab shows “Actions unavailable” with the reason instead of an empty list, and the endpoints answer 503 PROJECT_ROOT_UNAVAILABLE. See PROJECT_ROOT_UNAVAILABLE for the repair.
The E2E tab does the same for the locked regression suite in .rn-agent/e2e/: run the whole suite from the browser, watch per-flow progress live, and browse the history of previous runs with per-flow pass/fail detail. Suites started by the agent (via cdp_run_e2e_suite) show up here too.
Security posture
Section titled “Security posture”- Binds to
127.0.0.1only, on a random or configured port — never exposed to the network. - Rejects cross-origin requests via Host-header and
Sec-Fetch-Sitechecks. - Tool arguments are deep-redacted fail-closed before reaching the stream — tokens, passwords, and PII render as
[REDACTED_*]. - Text the agent types into the app never reaches the stream verbatim, whatever it contains.
device_fill,fillsteps insidedevice_batch, andcdp_interacttypeText/setFieldValuehave their text replaced with[REDACTED:string]plus atextLength(orvalueLength) count, and thetextechoed back in adevice_fillresult is redacted the same way. Ordering, the target element, status, and every other diagnostic field stay visible, so the timeline is still readable for debugging. - The event timeline lives in a small bounded in-memory ring buffer — the observability stream itself never touches disk. (Action RunRecords and locked E2E run output follow the session state directory: fenced sessions use their session-private runtime state, while an unfenced process uses
.rn-agent/state/for actions and.rn-agent/state/e2e-runs/for E2E history..rn-agent/e2e/contains the locked test definitions.)
When to use
Section titled “When to use”- During
/rn-feature-dev— keep it open in a second window to watch the pipeline work instead of tailing terminal output. - Reviewing a verification — the Route/Store/Tree tabs show the exact evidence the agent based its “it works” claim on.
- Regression spot-checks — replay an action or the locked E2E suite from the Actions/E2E tabs after a refactor.
- Debugging the agent itself — the errors-only filter plus per-event payloads make it easy to see which tool call went sideways.
See also
Section titled “See also”- Actions — what actions are and how the agent records them
/run-action— replay an action from the CLI instead/list-learned-actions— terminal inventory of the same library/test-feature— record new actions by verifying features